Magicfin
A financial management dashboard for tracking balances across currencies, monitoring transactions, and staying on top of market movements.
ROLE
Product Designer
TIMELINE
1 Month
TEAM
1 Designer, 1 Engineer
PLATFORM
Web
I was the sole designer on this project, working in a two-person team with one engineer on a fixed one-month deadline. The challenge wasn't just the product itself — it was making every design decision count under real time pressure: shipping authentication, dashboard, transaction views, and report export in a single sprint without sacrificing clarity or usability.
No single place to see the full picture
Business owners tracking finances across multiple currencies were juggling 4+ browser tabs, spreadsheets, and bank portals every day:
Opening 4+ browser tabs every morning to check TRY, USD, EUR, and GBP balances separately
No clear way to tell at a glance which company transactions were active versus pending
Exporting to spreadsheets just to review gross volume trends over different timeframes
Research to interface in four weeks
Research & discovery
8 user interviews and 2 surveys over three weeks. Mapped pain points across three distinct user types — business owner, finance manager, entrepreneur — each with different priorities but the same core frustration: no unified view.
Information architecture & wireframes
Mapped user flows and content hierarchy before drawing a single pixel. Navigation had to be flat to match research findings. Sketched layout options in FigJam to align structure with the engineer before committing to visual design.
High-fidelity & handoff
Refined with brand colors, a spacing system, and a component library built in Figma. Worked in tight iteration loops: structural decisions first, surface polish deferred. Shipped auth, dashboard, transactions, and report export in four weeks.
78%
check financial data every morning
4+ tabs
open during average daily check-in
~30 min
weekly follow-up on pending transactions
WHO WE DESIGNED FOR
Burak K.
Business Owner
"I just want one screen where I can see all my currencies at once."
Ayşe T.
Finance Manager
"The gross volume report is the first thing I check. One click would save me 20 minutes."
Can Y.
Entrepreneur
"Tracking which companies are active vs pending is a mess across 4–5 clients."
One unified dashboard
A dashboard that consolidates multi-currency balances, transaction activity, and volume trends into a single, scannable interface. Three core views, designed around the daily check-in routine.
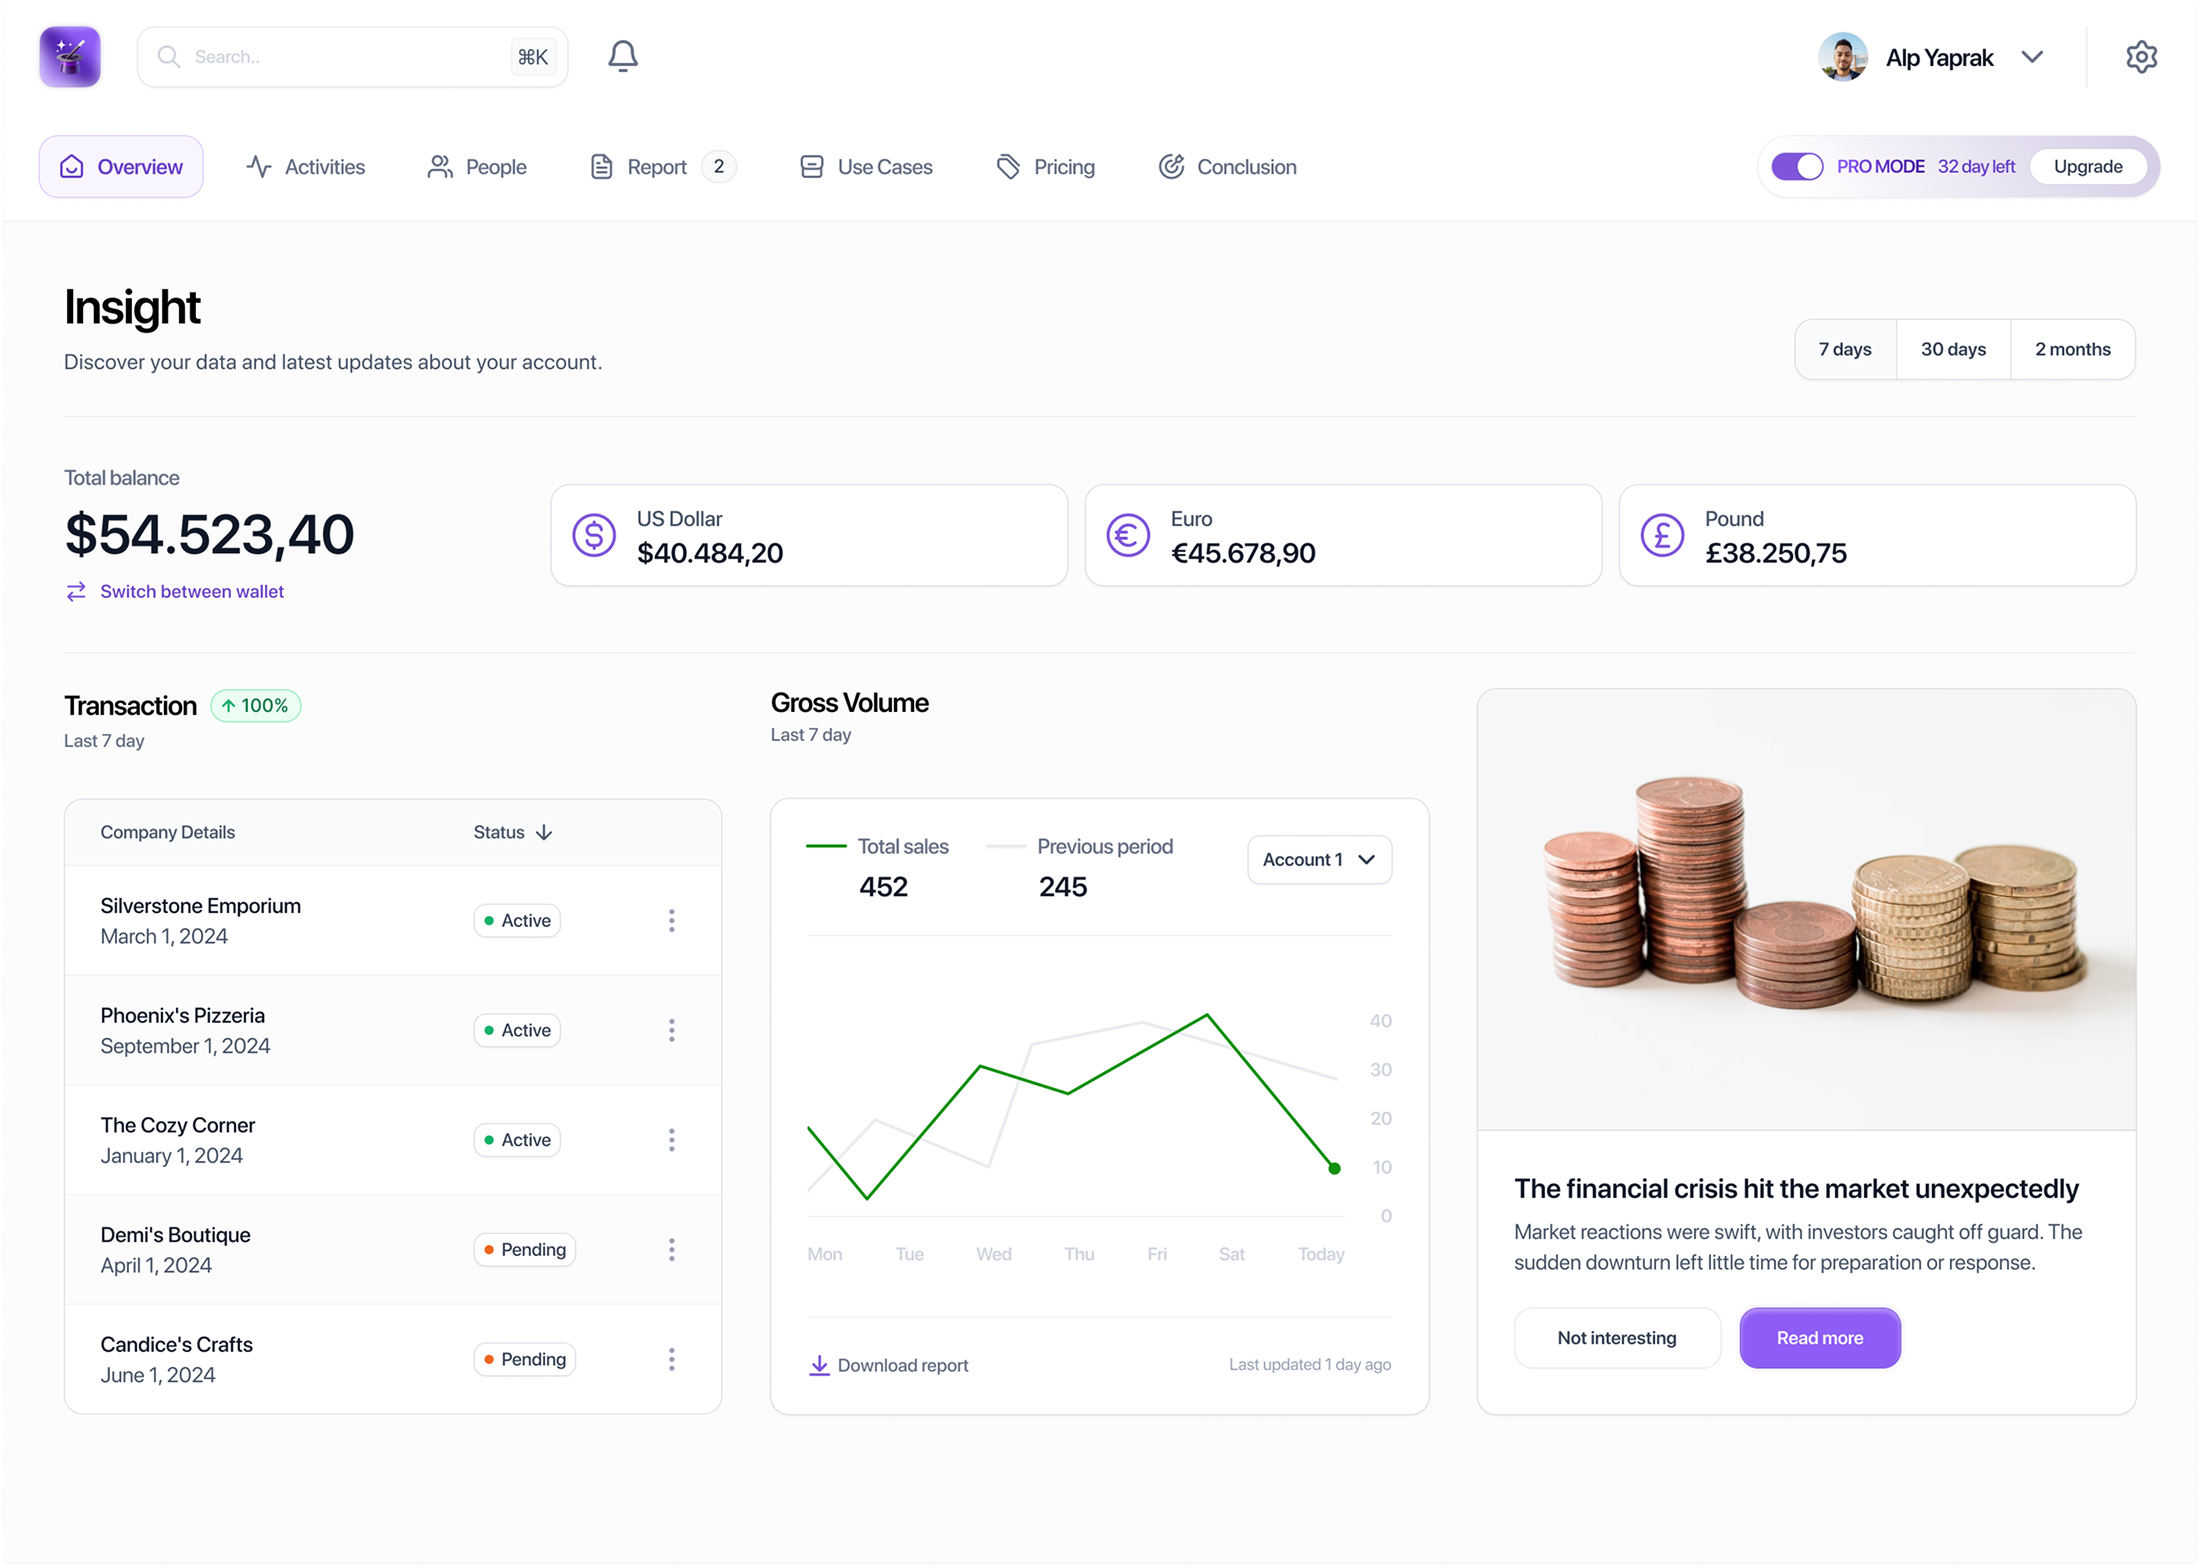
Insight Dashboard
A single command center showing total balance, transaction list, gross volume chart, and market news. Configurable 7-day, 30-day, and 2-month timeframes let users scan performance at a glance — no tab-switching required.
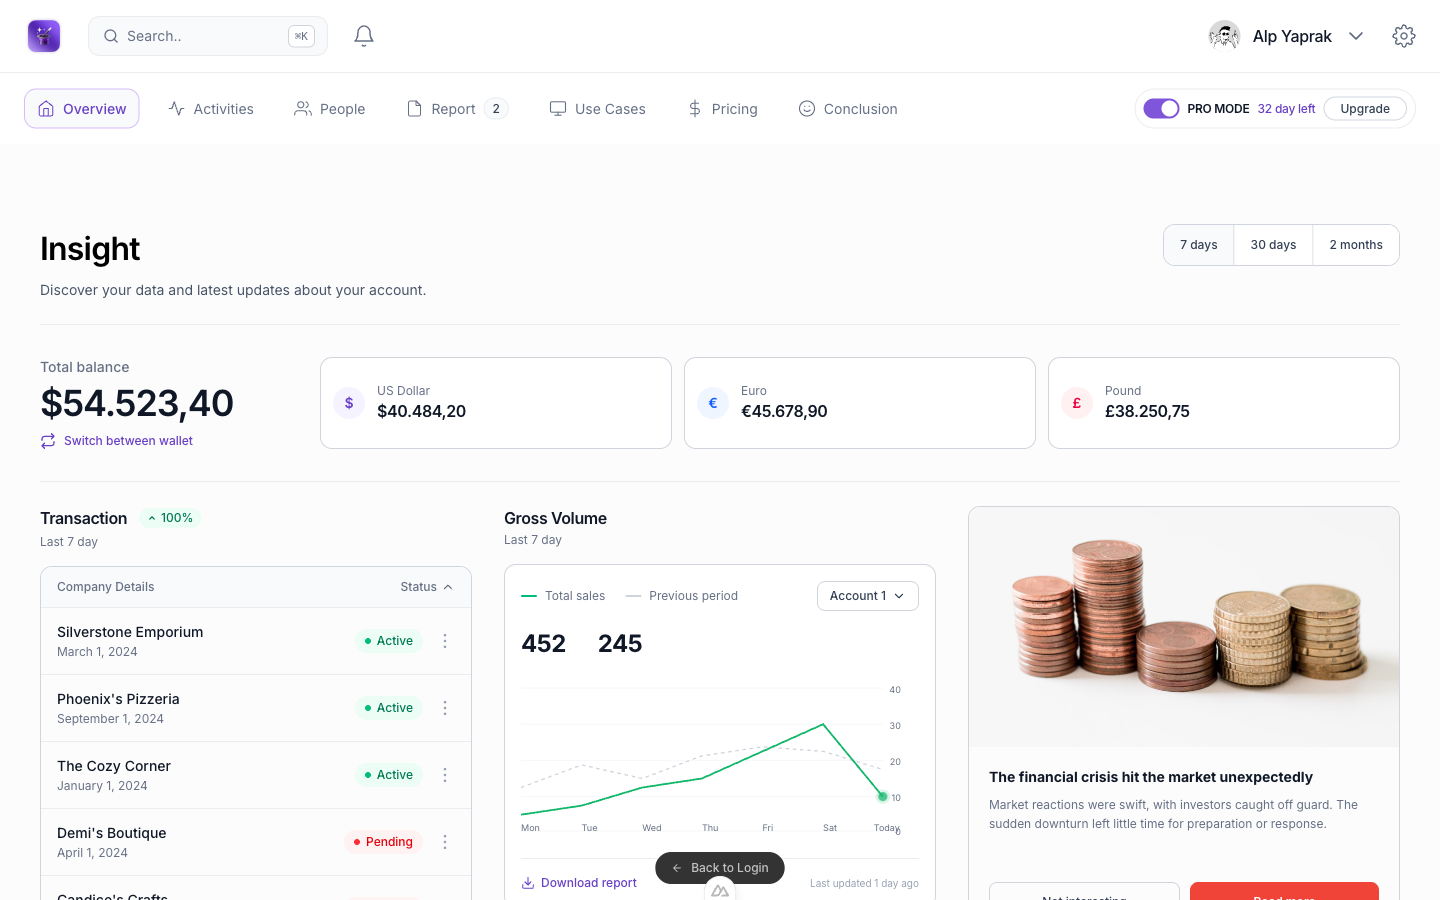
Multi-Currency Wallet
Simultaneous balance cards for TRY, USD, EUR, and GBP. The "Switch between wallet" interaction lets users flip currency contexts without leaving the main dashboard view.
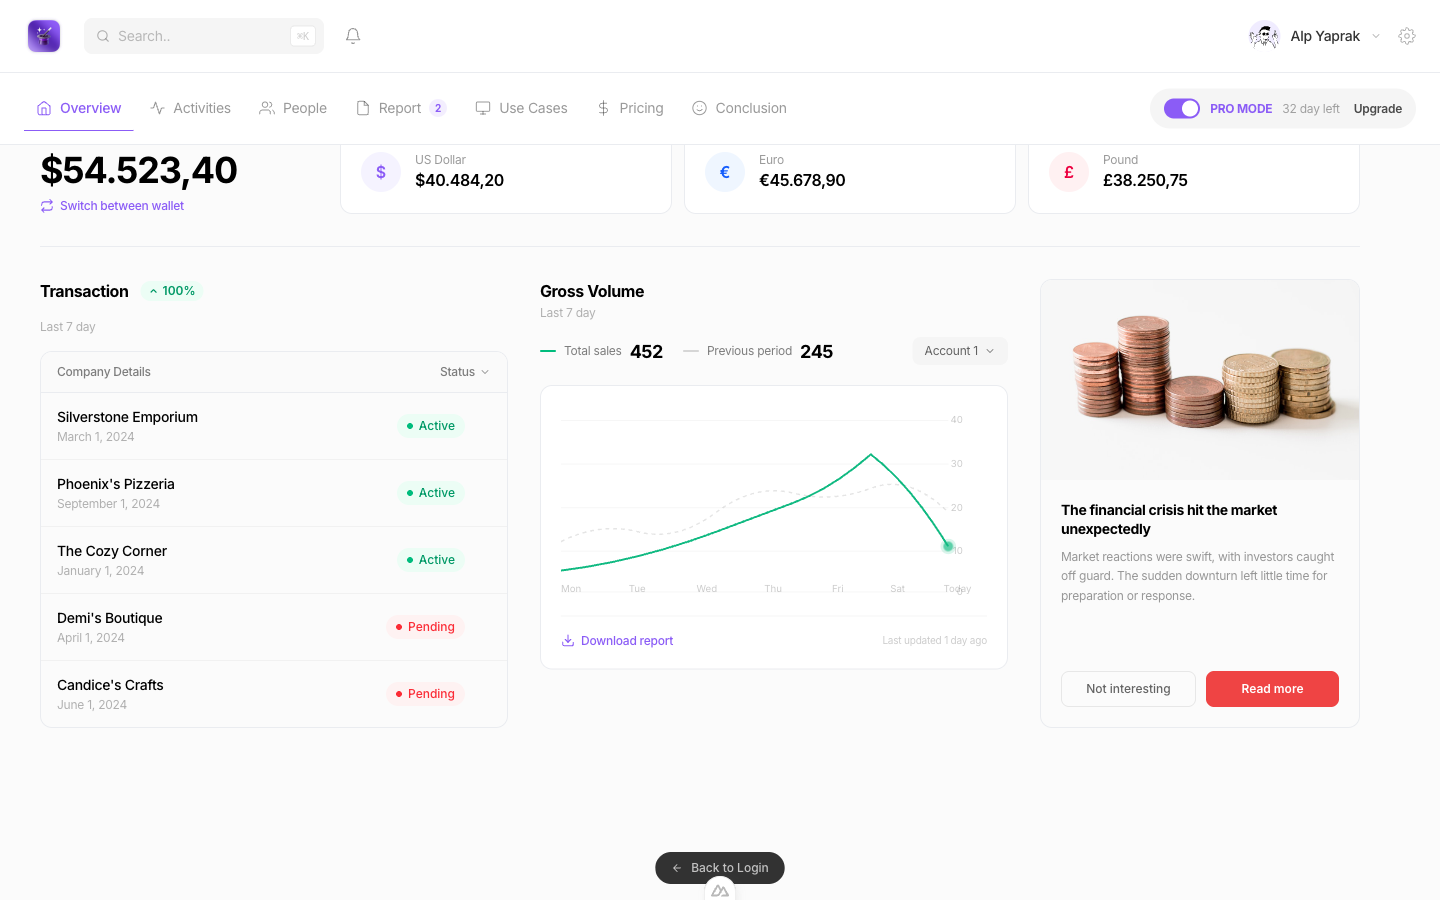
Transaction Status View
A company-level transaction list with clear Active and Pending status indicators, sortable by date. Replaces the need for separate spreadsheet tracking — the most frequently cited pain point in research.
Localization lives in the details
Currency formatting turned out to be surprisingly loaded. Early mockups used dot notation for thousands, but Turkish users read commas differently than Western European ones — a small detail that surfaced quickly and shaped the final number display.
Front-load structure, defer polish
Working with one engineer in a compressed timeline taught me to make structural decisions early and defer surface polish. Knowing what the engineer could build confidently in a day changed how I scoped each design pass.
Subtraction is the hardest design work
Financial dashboards pull toward 'more is more' — there's always another metric worth showing. The hardest work wasn't deciding what to add. It was defending what to leave out.
Based on moderated usability sessions with 8 participants.
~35%
Faster daily financial check-in
4.7★
Usability score in testing
1 tab
Replaces 4+ browser tabs in daily workflow
~60%
Less context-switching between apps
NEXT CASE STUDY
Outlinx — Outlet operations platform